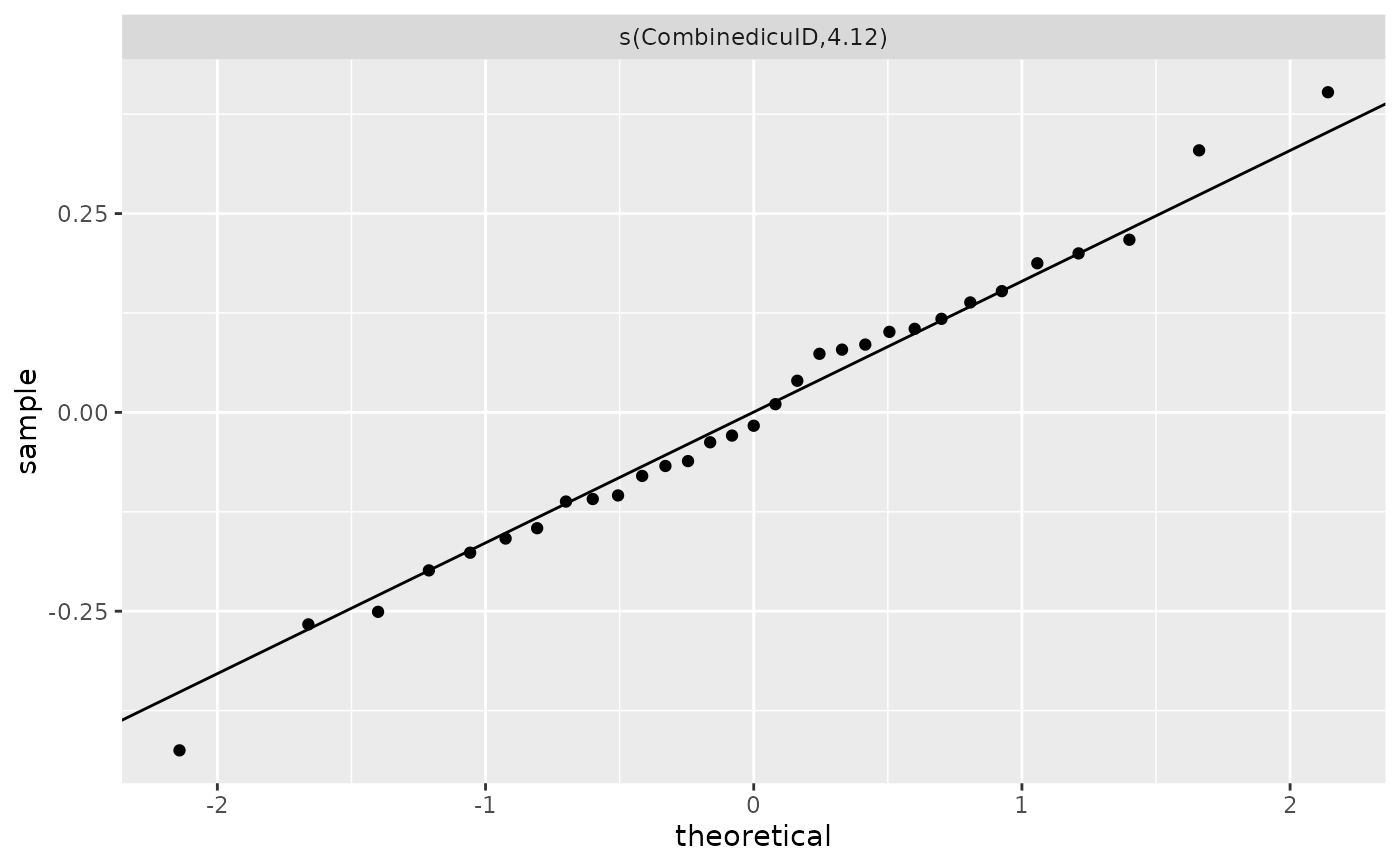
Plot Normal QQ plots for random effects
gg_re(x, ...)Arguments
- x
a fitted
gamobject as produced bygam().- ...
Further arguments passed to
plot.gam
See also
Examples
library(pammtools)
data("patient")
ped <- patient %>%
 dplyr::slice(1:100) %>%
 as_ped(Surv(Survdays, PatientDied)~ ApacheIIScore + CombinedicuID, id="CombinedID")
pam <- mgcv::gam(ped_status ~ s(tend) + ApacheIIScore + s(CombinedicuID, bs="re"),
 data=ped, family=poisson(), offset=offset)
gg_re(pam)

plot(pam, select = 2)
