Flexible, high-level plotting function for (non-linear) effects conditional on further covariate specifications and potentially relative to a comparison specification.
gg_slice(data, model, term, ..., reference = NULL, ci = TRUE)Arguments
- data
Data used to fit the
model.- model
A suitable model object which will be used to estimate the partial effect of
term.- term
A character string indicating the model term for which partial effects should be plotted.
- ...
Covariate specifications (expressions) that will be evaluated by looking for variables in
x. Must be of the formz = f(z)wherezis a variable in the data set andfa known function that can be usefully applied toz. Note that this is also necessary for single value specifications (e.g.age = c(50)). For data in PED (piece-wise exponential data) format, one can also specify the time argument, but see "Details" an "Examples" below.- reference
If specified, should be a list with covariate value pairs, e.g.
list(x1 = 1, x2=50). The calculated partial effect will be relative to an observation specified inreference.- ci
Logical. Indicates if confidence intervals for the
termof interest should be calculated/plotted. Defaults toTRUE.
Examples
ped <- tumor[1:200, ] %>% as_ped(Surv(days, status) ~ . )
model <- mgcv::gam(ped_status~s(tend) + s(age, by = complications), data=ped,
  family = poisson(), offset=offset)
make_newdata(ped, age = seq_range(age, 20), complications = levels(complications))
#> # A tibble: 40 × 14
#>    tstart  tend intlen interval    id offset ped_status charlson_score   age
#>     <dbl> <dbl>  <dbl> <fct>    <dbl>  <dbl>      <dbl>          <dbl> <dbl>
#>  1      0     5      5 (0,5]     101.   1.61          0           2.71  16
#>  2      0     5      5 (0,5]     101.   1.61          0           2.71  19.9
#>  3      0     5      5 (0,5]     101.   1.61          0           2.71  23.8
#>  4      0     5      5 (0,5]     101.   1.61          0           2.71  27.7
#>  5      0     5      5 (0,5]     101.   1.61          0           2.71  31.6
#>  6      0     5      5 (0,5]     101.   1.61          0           2.71  35.5
#>  7      0     5      5 (0,5]     101.   1.61          0           2.71  39.4
#>  8      0     5      5 (0,5]     101.   1.61          0           2.71  43.3
#>  9      0     5      5 (0,5]     101.   1.61          0           2.71  47.2
#> 10      0     5      5 (0,5]     101.   1.61          0           2.71  51.1
#> # ℹ 30 more rows
#> # ℹ 5 more variables: sex <fct>, transfusion <fct>, complications <chr>,
#> #   metastases <fct>, resection <fct>
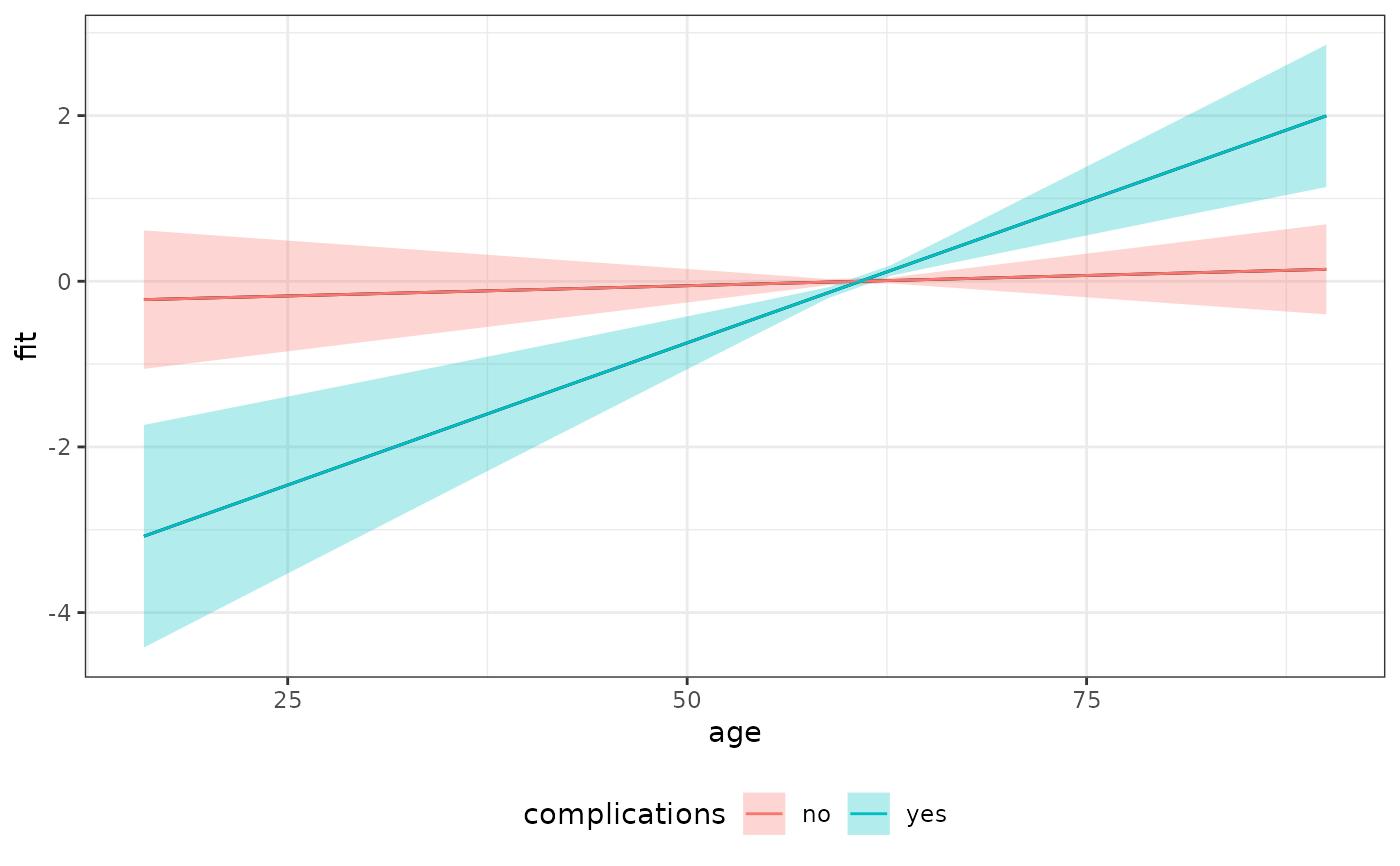
gg_slice(ped, model, "age", age=seq_range(age, 20), complications=levels(complications))

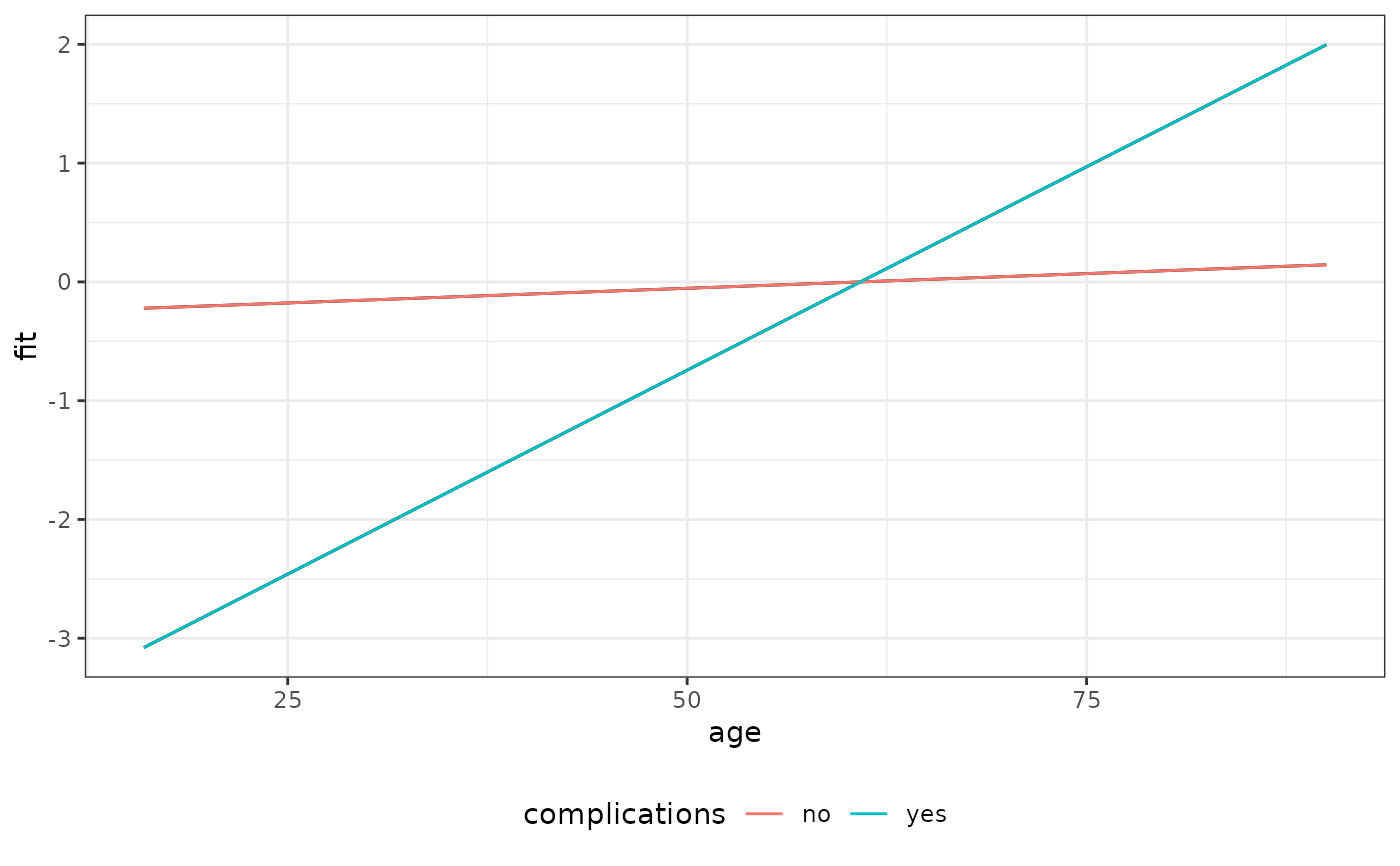
gg_slice(ped, model, "age", age=seq_range(age, 20), complications=levels(complications),
 ci = FALSE)

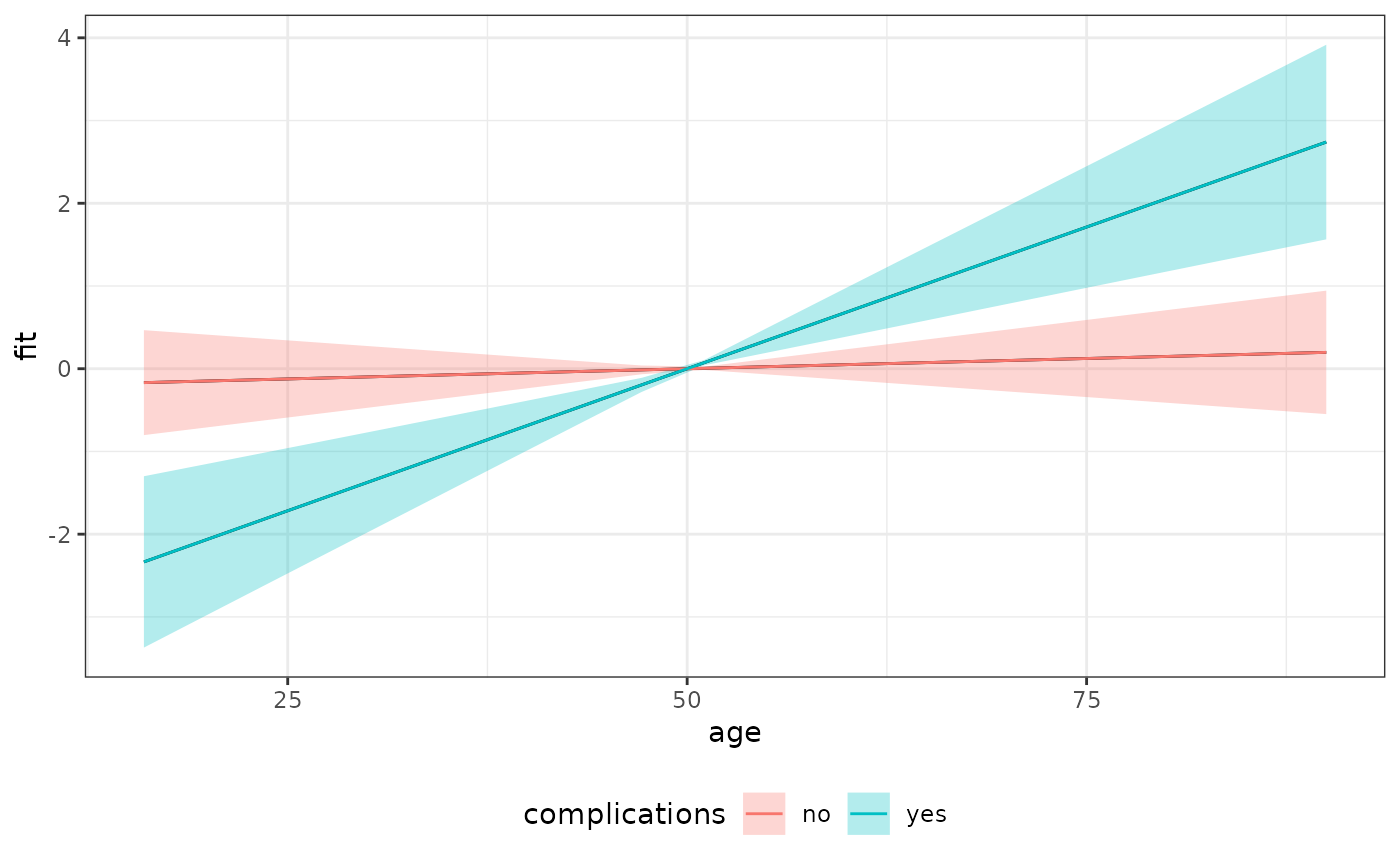
gg_slice(ped, model, "age", age=seq_range(age, 20), complications=levels(complications),
  reference=list(age = 50))
